Climate Change in Human History
The survival of our systems depends on getting the low-entropy resource from the environment, throwing the high-entropy waste into the environment, and maintaining the low-entropy structure against the environment. That is why the fluctuation of the environment has changed human history. Environmental history is now in fashion thanks to the rise of environmentalism, but I would like to reconstruct environmental history in terms of my theory of entropy.

1. The General Tendency of History
1.1. The Solar Influence on the Earth
The most important and fundamental factor of changing history is solar radiation, as the living systems depend on it for most of the low-entropy resources. The solar radiance varies according to the relation between the Sun and the Earth. As is well-known, the rotation of the Earth on its axis causes the daily cycle while the revolution of the Earth around the Sun causes the annual cycle. Besides them, there are longer cycles that affect the solar radiance on the Earth, named Milankovitch cycles. According to Milankovitch’s theory, the eccentricity, the axial tilt, and the precession cause the variation of the Earth’s orbit, thus resulting in a 100 thousand year cycle in the Ice Age.
Not only the relation between the Sun and the Earth but also the solar output varies. The major solar variation follows the 11-year sunspot cycle. William Stanley Jevons, an economist in Britain and one of the principal contributors to the marginal revolution, claimed that there was a connection between commercial crises and the 11-year solar cycle.[1] Before Jevons’ claim, Frederick William Herschel, a British astronomer famous for discovering the planet Uranus, had discovered the connections between wheat price and solar spots.[2]
But the mainstream scientists did not accept their theories because the detailed causal connection was unknown. The variation in annual mean total solar irradiance is only 0.08% (or about 1.1 W/m2) between the minimum and the maximum of the 11-year solar cycle.[3] Though the accumulated variation can have a little influence on surface temperature, it cannot change global climate drastically.
1.2. The Material Entropy
In 1997 Svensmark and Friis-Christensen discovered that cloud cover correlates with the galactic cosmic ray intensity, which varies with the sunspot cycle[4]. Galactic cosmic rays are high-energy charged particles that enter the solar system from the Galaxy. They penetrate the atmosphere to create large numbers of ions and radicals, around which water vapor condenses and forms clouds. When the number of sunspots increases, the solar wind blows strongly and ejects galactic cosmic rays from the solar system. Hence, an increase in sunspots leads to a decrease in cloudiness and an increase in temperature.
The sunspot minimum is a hard time when it is difficult for living systems to get resources and therefore they have to gather and cooperate to obtain heat sources, especially food effectively. The sunspot maximum is a propitious time when living systems can easily get the resources and scatter to throw waste heat effectively. So, we can say power centralizes in a cool period while it decentralizes in a warm period.
There is another reason for the tendency. When cooling reduces the availability of food, warfare could be the ultimate means of getting resources. David D. Zhang and his team looked at the impact of climate change on warfare frequency over the last millennium in eastern China and found that almost all peaks of warfare frequency and dynastic changes occurred in a cooling phase[5]. Obviously, the centralization of power is necessary in order to win the war. Maybe we can generalize their findings to the rest of the world.
1.3. The Information Entropy
There is another tendency. Intellectual revolution takes place in a cool period to overcome the crisis while intellectual stagnation to preserve the status quo takes place in a warm period. We can explain this tendency not only in terms of necessity but also ability. The solar wind produces electromagnetic radiation, causes fluctuations in the geomagnetic field, and possibly affects human brains. The more active the Sun is, the higher the information entropy is. That might be the reason warm periods tend to be dark ages, with few intellectual achievements.
The cool period is more critical than the warm from the viewpoint of thermal entropy, while the warm period is more critical than the cool from the viewpoint of information entropy. The strong intellectual ability compensates for the shortage of material resources during the cool period, while the amplitude of material resources compensates for the weak intellectual ability during the warm period. This compensation is a happy dispensation of the world.
In this article, we will recognize the law of history from the viewpoint of entropy. The law can apply to other living systems, but here I would like to confine myself to applying it to human history.
2. The Human Evolution
As the climate record constructed by combining measurements from globally distributed deep-sea sediment cores indicates[6], it has gotten colder since the humans branched from the chimpanzee. This means that we have evolved in a deteriorating environment. I will take up four innovations as milestones of human evolution, the formation of family, migration of the modern human out of Africa, the invention of clothing, and the so-called “Great Leap Forward".
2.1. The Formation of Family
Our ancestors in Africa seem to have lived near or in freshwater areas, such as lakes, marsh, ponds, and rivers. Bipedalism, nakedness, abundant fatty layers, and so on can result from the adaptation to the semi-aquatic environment.
As it got cooler and drier, the freshwater areas shrank and our ancestors had to live in the savanna. Australopithecus, Paranthropus, and other Hominids died off, while Homo survived. The first species of the Homo genus was Homo habilis, but the species really innovative and distinct from other human ancestors is Homo ergaster, which lived throughout eastern and southern Africa 1.9-1.4 million years ago.
The former hominids showed strong sexual dimorphism. Generally speaking, the stronger the dimorphism in a species is, the more likely it is to be polygamous and the less caring for offspring the male shares with the female. The reduced sexual dimorphism of Homo ergaster suggests it began social monogamy with the male taking part in caring for offspring.
The male of Homo ergaster were the first hunters. They developed various tools such as hand-axes and cleavers, creatively used fire, cooked food, and supported their family. The support of both parents must have contributed to the survival of their offspring. Homo erectus followed this social revolution and spread out of Africa.
Here we can apply the law of history: the power centralizes and the intellectual revolution takes place during the cooler period. The formation of the family is the centralization of human systems and the sophisticated hunting technology results from intellectual innovation.
2.2. The Birth of Modern Human
The modern human, namely Homo sapiens, evolved from Homo sapiens idaltu 143 thousand years ago in the coldest period of Wolstonian glaciation. The genetic innovation occurred during a cooler period. So did the cultural innovation.
The graph below shows the temperature fluctuation and innovations in the last glaciation.
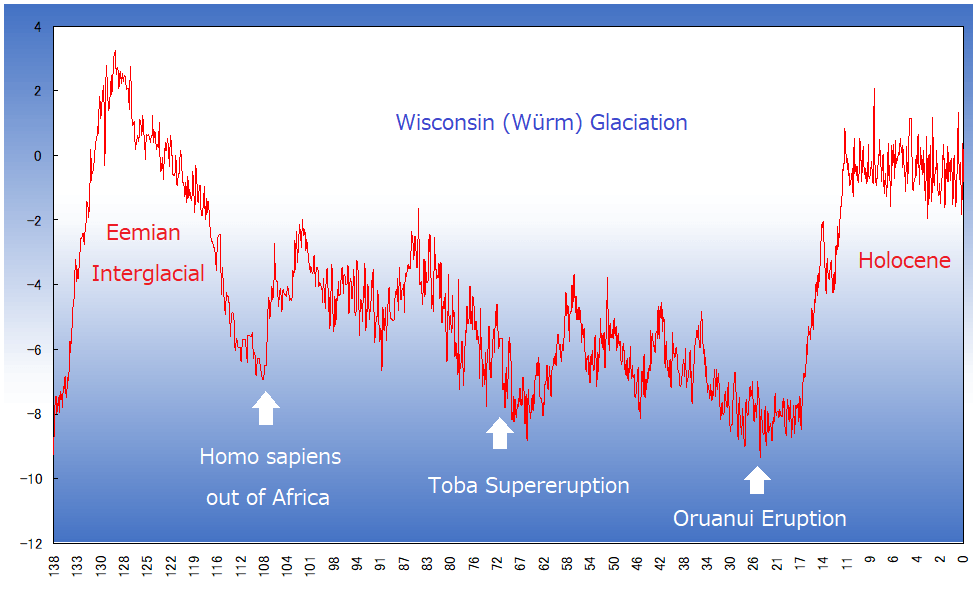
The warmer period on the left of the graph is the Eemian interglacial era that followed the Wolstonian glaciation. When it ended, it got colder and drier again in Africa, which drove the modern human out of Africa. Before they got to wear clothing, however, they could at most advance along the shorelines of Saudi Arabia, India, South East Asia, and Australia.
Marian Vanhaeren and others found the oldest evidence of symbolism at this time. They say:
Perforated marine gastropod shells at the western Asian site of Skhul and the North African site of Oued Djebbana indicate the early use of beads by modern humans in these regions. The remoteness of these sites from the seashore and a comparison of the shells to natural shell assemblages indicate deliberate selection and transport by humans for symbolic use. Elemental and chemical analyses of sediment matrix adhered to one Nassarius gibbosulus from Skhul indicate that the shell bead came from a layer containing 10 human fossils and dating to 100,000 to 135,000 years ago, about 25,000 years earlier than previous evidence for personal decoration by modern humans in South Africa.[8]
They might use the perforated shells as money rather than mere ornaments. In that case, wearing them as a necklace was a way of storing the money. Here, you can see the development of the communication media in a cooling period.
Professor Alison Brooks, an expert in African archaeology at George Washington University, said, “It supports my thought that there are no great revolutions in the evolution of modern human behavior – it is a gradual process."[9] Certainly, this finding reveals that the so-called “Great Leap Forward" was not so “Great" as was once thought to be, but not necessarily that human progress was gradual. All living things are conservative and try to remain the same so long as it is unnecessary to change. I suppose Punctuated Equilibrium in cultural history as well as evolutionary history and what punctuates the equilibrium was cooling and drying.
2.3. The Invention of Clothing
Another important step in human evolution is the invention of clothing. Scientists at Max Planck Institute for Evolutionary Anthropology estimated that humans adopted the frequent use of clothing about 72,000 ± 42,000 years ago.[10] They used a molecular clock approach to date the evolution of the body louse (Pediculus humanus corporis) from the head louse (Pediculus humanus capitis). As humans got to wear clothes, lice could advance to a new frontier of the human body.
It is not a coincidence that a supervolcanic event occurred simultaneously. The Toba caldera in Indonesia underwent a mega-colossal eruption with a VEI of 8 about 71,500 ± 4000 years ago. VEI (Volcanic Explosivity Index) is a relative measure of the explosiveness of volcanic eruptions, ranging from 0 to 8 according to the volume of ejected tephra. There have been no Holocene eruptions with a VEI of 8. The Toba eruption is possibly the largest within the last two million years.
The volcanic eruption injects water vapor (H2O), sulfur dioxide (SO2), hydrogen chloride (HCl), hydrogen fluoride (HF), ash (pulverized rock and pumice), etc. into the stratosphere. The ejected ash interrupts sunlight and hinders the photosynthesis of plants. Most of the hydrogen chlorides and hydrogen fluorides dissolve in water droplets in the eruption cloud and quickly fall to the ground as acid rain. Both have devastating effects on plants.
Water vapor converts sulfur dioxide to sulfuric acid, which condenses rapidly in the stratosphere and forms fine sulfate aerosols. The aerosols increase the Earth’s albedo (that is to say, they reflect more radiation from the Sun back into outer space), thus cooling the Earth’s lower atmosphere. On the other hand, they also absorb heat radiated up from the Earth, thereby warming the stratosphere. When the surface gets warmer and the stratosphere becomes cooler, the convection in the atmosphere is activated. Otherwise, it stagnates.
The volcanic eruption not only interrupts the supply of the low-entropy energy to plants but also stagnates the convection-driven air circulation, hindering the living systems from throwing the high-entropy wastes into outer space.
According to the Toba catastrophe theory proposed by Stanley H. Ambrose, the Toba event reduced the human population to 10,000 or even 1,000 breeding pairs. Thus all the other human species except for the two branches that became Neanderthals and modern humans became extinct.[11]
Necessity is the mother of invention. The “volcanic winter" resulted in a decrease in average global temperatures by 3 to 3.5 degrees Celsius for several years. It must have been this abrupt cooling that drove Neanderthals and modern humans to invent clothing.
The first human species that migrated out of Africa was Homo erectus, but Georgia in Europe and Beijing in China was the northern limit where they could advance. Thanks to the spread of clothing, humans could break through the limit and migrate to colder regions, such as Europe, Siberia, and North America. Clothing was really a breakthrough technology for humans to spread all over the Continents. We hardly know what social systems they formed, but the large-scale migration indicates the existence of powerful leaders.
2.4. The Great Leap Forward
Look at the graph above again. After the Toba catastrophe, the modern humans underwent another bottom era but clothing helped them to advance northward. You can see another bottom, the coldest era in the Wisconsin (Würm) Glaciation, when Neanderthal became extinct, though modern humans survived the era and now flourish. What made the difference?
The average skull capacity of Homo neanderthalensis was 10% greater than that of Homo sapiens. But what it means is not that Homo neanderthalensis was more intelligent than Homo sapiens, but that the former had a larger body than the latter. A more credible criterion of intelligence is the rate of the weight of the frontal lobe to the cortex. Homo neanderthalensis was not as intelligent as Homo sapiens because the frontal lobe of the former was not as developed as that of the latter.
The frontal lobe is an area in the brain of vertebrates, located at the front of each cerebral hemisphere. It has the selective and executive function to control and manage the information processed at the other lobes. The brain of Homo sapiens has more combining and networking functions than that of Homo neanderthalensis. So are their societies.
Homo neanderthalensis settled down in a place and lived a self-sufficient life. The productivity of a self-sufficient economy in a limited area was low. The Neanderthal men worked hard to compensate for this low productivity, which made their bodies stout. Meanwhile, the modern human moved around for a better game and traded various commodities with other families. Homo neanderthalensis was resident and isolated, while Homo sapiens were migratory and trade networking.
Homo neanderthalensis seemed to speak the language, but their language was not highly articulated. The highly articulated language develops when one encounters another culture. The tacit understanding is enough within the family. We can see many cave paintings that reflect the desire of Homo sapiens for representation, but Homo neanderthalensis left no such remains. Homo sapiens networked ideas and created sophisticated culture.
Homo sapiens were not sophisticated from the beginning. About 50–40 thousand years ago Homo sapiens showed the cultural innovation named “Great Leap Forward".[12] The essence of the innovation is the networking based on the brain structure and applied to the linguistic and social structure.
Through the Great Leap Forward, modern humans also developed sophisticated hunting techniques, such as pitfall traps, or driving animals to fall off cliffs. Once they sophisticated the ability to use language, it became easy to transmit new technologies from generation to generation.
3. Revolutions in the Holocene
3.1. The Neolithic Revolution
The graph below represents the temperature fluctuation in the transition from Pleistocene to Holocene and the climate periods from Oldest Dryas to Atlantic.

The Oldest Dryas occurred during the coldest stadial after the Wisconsin glaciation, while the Bølling and Allerød periods followed it with a brief cooling intermission known as the Older Dryas period. The temperatures in the northern Atlantic region rose from glacial to the present-day level during this warming oscillation.
The warming oscillation must have increased the human population. Then came the Younger Dryas, a rapid return to glacial conditions mainly in the higher latitudes of the Northern Hemisphere. The cold and dry Younger Dryas lowered the carrying capacity of a population level and forced hunter-gatherers to start cereal cultivation. In the 1920s, Vere Gordon Childe named the transition from hunting and gathering to agriculture the “Neolithic Revolution". Abu Hureyra, an ancient settlement in the northern Levant, is thought to be the place where the Neolithic Revolution first occurred.
Recent evidence from the site of Abu Hureyra suggests that systematic cultivation of cereals started well before the end of the Pleistocene by at least 13000 years ago, and that rye was among the first crops. The evidence also shows that hunter-gatherers at Abu Hureyra first started cultivating crops in response to a steep decline in wild plants that had served as staple foods for at least the preceding four centuries. The decline in these wild staples is attributable to a sudden, dry, cold, climatic reversal equivalent to the ‘Younger Dryas’ period. At Abu Hureyra, therefore, it appears that the primary trigger for the occupants to start cultivating caloric staples was climate change.[14]
Today there remain hunter-gatherers in the world. They do not engage in agriculture, not because they do not know how to grow plants, but because agriculture requires harder work than hunting and gathering. According to a report on hunter-gathers, the average time per adult worker per day put into the appropriation and preparation of food is three to five hours.[15] So long as one can enjoy such an “Original Affluent Society", no one dared to cultivate crops. It was not until they faced hunger that the Neolithic Revolution started.
Let’s describe this revolution in terms of my system theory. The deteriorating environment means the increase in material entropy and people began to produce the low-entropy resources by themselves. Agriculture is a labor-intensive industry and requires special techniques. Here again, we can apply the law of history: power centralizes and intellectual revolution takes place in the cooler period.
When the Younger Dryas ended and the Pre-Boreal warming started, the agricultural society afforded to raise cattle thanks to the overproduction of cereal. Agriculture replaced gathering in the cooling period and cattle breeding replaced gathering in the warming period. Farmers used livestock first for meat, and then for traction, transport, wool, and milk. This secondary product revolution was disseminated as part of the process leading to urbanization.[16]
3.2. The Urban Revolution
The Urban Revolution, which again Vere Gordon Childe gave a name to[17], also happened during a cooling period. After the 8200 BP event, a long warm period known as “Holocene Climate Optimum" or “Atlantic" lasted until about 3000 BC. Then came a cool period that brought about civilizations. There is no name for this cool period. So I will call it the “Subboreal Cool Period", following the name of pollen zone divisions. Here is a graph of temperature fluctuation from 5000 BC to AD 200 reconstructed from oxygen isotope data of the Greenland ice core.

Here is another graph of temperature fluctuation from 6000 BC to 400 BC reconstructed from pollen assemblages preserved in a sediment core from northern Finland.
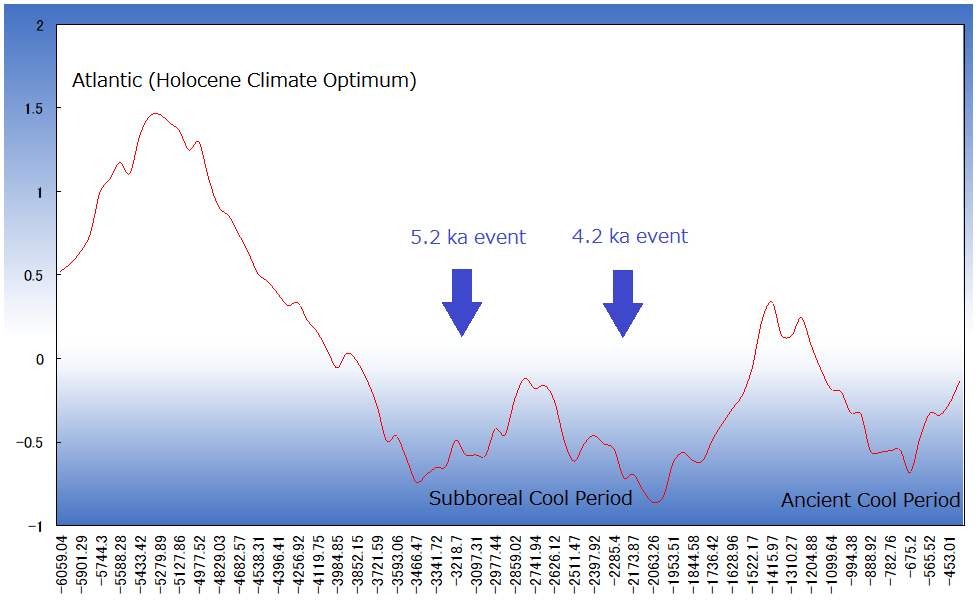
When the Subboreal Cool Period begins, regions from 35° north latitude southwards, such as Mesopotamia, the Nile Delta, the Indus plains, and southern China got cold and dry, while regions from 35° north latitude northwards, such as the Anatolian Plains and the Tibetan Plateau got cold and wet. It was this climate change that caused Sumerian, Egyptian, Indian, and Chinese Civilizations to rise.[20]
The Japanese meteorologist and geographer Hideo Suzuki has made the interesting suggestion that it was the refugee herdsmen and farmers from the increasing desert regions round about who were fated to become the slaves who made possible the intensive agriculture and the great building works for which ancient Egypt and the other river valley civilizations are famous.[21]
The bottom around 2700 BC corresponds to the age of the Urban Revolution, when these major civilizations flourished almost at the same time. Take the Sumerian Civilization as an example. The precipitation in the upper reaches of the Euphrates and the Tigris rivers increased, while that in their lowlands decreased. The rivers got swollen and the surrounding farmlands dried up. Farmers naturally rushed to the riversides to look for irrigation water. But mere gathering does not lead to civilization.
The word “civilization" comes from the Latin word “civis", meaning townsman or citizen. The word “civis" contrasts with the Latin word “barbaria", meaning barbarian, which further stems from the ancient Greek word “βάρβαρος", meaning a non-Greek. A non-Greek’s speech sounded “bar bar" to the Greeks and “βάρβαρος" was an imitative word for the unintelligible babble. Can we say whether the communication media mediated people or not is the criterion for civilization?
The communication media (language, money, and punishment) had functioned to some degree before the Civilizations emerged, but these media became important when people gathered, resulting in high population density and high social entropy.
We can attribute the difference between civilization and culture to that between urban and rural. The word “culture" comes from the Latin word “colere", meaning “cultivate". The Neolithic Revolution was the Culture Revolution, while the Urban Revolution was the civilization revolution. Again, centralization and intellectual sophistication characterize both revolutions, but the Urban Revolution requires more centralization and intellectual sophistication because of the high population density.
Suppose people rush to the riversides to seek irrigation water, as must have happened at the beginning of the Subboreal Cold Period. They will quarrel with one another, struggling for water or harvest. This chaotic uncertainty increases social entropy and those who have cultural, economic, and political capital and therefore can control the three media (language, money, and punishment), must intervene to reduce this social entropy.
The Civilizations I mentioned above disappeared or declined after 1800 BC. You can see the peak named Subboreal Warm Period in the graph above. The warming trend reversed after 1800 BC. precipitation increased in the northern region, but not in the southern populous region. Farmers do not have to depend on cities any longer. They left cities and scattered to the northern countries.
Some attribute the Dark Age after 1800 BC to the invasion and destruction by nomads, but the Civilization would have disappeared or declined without the migration of the nomads. The Dark Age is so named not because it was the miserable age, but because there remained few written records of the age. As I stated before, power decentralizes and intellectual stagnation takes place during the warmer period.
3.3. The Achsenzeit Revolution
The word “Achsenzeit" is a term that German philosopher Karl Jaspers coined, meaning the Axis Age.[22]It is the period from 800 BC to 200 BC, pivotal in the history of thought. Greek philosophers such as Socrates (circa 470-399 BC) and Plato (428/427-348/347 BC), Zoroaster (628-551 BC), the founder of the first monotheistic religion, the prophets in Israel such as Elijah, Isaiah and Jeremiah, Upanishad philosophers and Siddhartha Gautama (463-383BC) in India, Confucius (551BC-479BC) and other Hundred Schools of Thought in China appeared during this age.
Look at the two graphs above again. The temperature from 800-200BC is low. What should I call this period? Geologists named the period from Achsenzeit to the present Subatlantic according to pollen zone divisions. This period is too long for historical analysis. So, I will adopt the classical division into three periods, Antiquity, the Middle Ages, and Modern Times. It is not accidental that each epoch begins with a cooling event, lasts over a warm period, and ends with the next cooling event because an epoch-making event occurs in a cooling period.
Monotheism or, more exactly, paternal religion came into being and spread during the Ancient Cool Period and Medieval Cool Period. The first attempt at monotheism was the Aten cult in the reign of the Egyptian Pharaoh, Akhenaten, though it turned out to be a failure. The first successful monotheism is Zoroastrianism, which worshiped Ahura Mazda as the transcendental and universal God. But the most influential early monotheism is Judaism, from which Christianity and Islam stemmed.
Castration, as well as monotheism, is an important feature of paternal religion. Here I use this term in a Freudian meaning. According to Freud, human children passed through stages, oral, anal, phallic, latency, and genital stage, till they become independent of their mother. Freud tried to apply the recapitulation thesis “Ontogeny recapitulates phylogeny"[23] to his theory of psychosexual development.[24] I will also try to apply the recapitulation theory to these stages:
- Getting out of the aquatic environment corresponds to getting out of amniotic fluid.
- The oral stage corresponds to cannibalism. Like infants, early humans depend on Mother Nature. The Lacanian “stade du miroir" that divides oral/anal stages corresponds to the Great Leap Forward, the linguistic revolution.
- The anal stage corresponds to the ages when humans store harvest and trade it with others.
- The phallic stage corresponds to the male-dominant age after the Urban Revolution, though humans still worshiped the Mother God, like the boy attaching to his mother. The transition from maternal to paternal religion corresponds to the castration and the repression of the Oedipus complex. Since Mother Nature got cold, humans had to abandon their adherence to Mother God.
Though Buddhism is neither monotheism nor polytheism, because it does not believe in any gods, it is a paternal religion, because it is a typical religion of castration. Siddhartha Gautama taught that one should stop clinging to the unawakened, worldly life because it causes suffering.
The major three paternal religions, Christianity, Islam, and Buddhism, spread throughout the world during the Medieval Cool Period. These revolutions were the intellectual revolutions as well as the spiritual centralization.
3.4. The Industrial Revolution
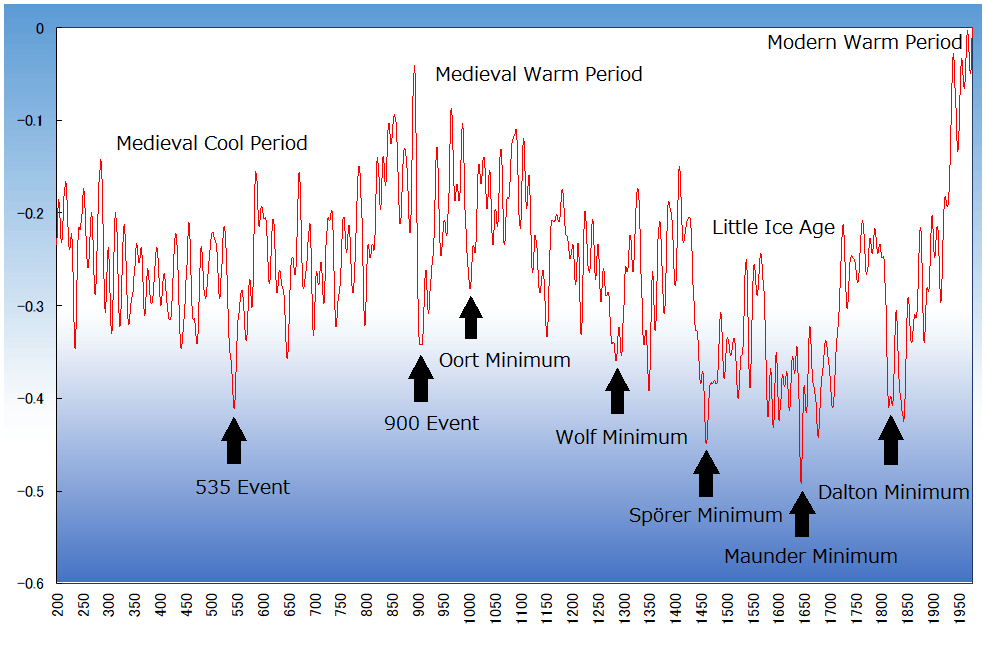
The Industrial Revolution took place in the cold period, named the Little Ice Age. See the graph of temperature fluctuation below.
The Industrial Revolution began with the textile industry. As it got cold, the demand for clothing in the world increased and Britain, which had many colonies over the world, had to produce textiles in bulk quickly. This is because the Little Ice Age caused the Industrial Revolution in Britain.
During the Little Ice Age, solar activity as seen in sunspots was extremely low, with no or few sunspots. So, we can attribute the three deep troughs of the temperature during the Little Ice Age to three periods of sunspot minimum, namely Spörer Minimum (1450-1550), Maunder Minimum (1645-1715), and Dalton Minimum (1790-1820).
- The Spörer Minimum corresponds to the age of Enclosure in Britain during the 15th and 16th centuries. Since it got cold, the demand for wool increased and sheep farming grew profitable. But at this period, Britain just exported wool without processing it.
- Maunder Minimum corresponds to the age of manufacturing textiles made with wool from the sheep-farming areas created as a result of the Enclosure in Britain. Britain must produce the wool products by herself to meet the increasing demand for textiles.
- Dalton Minimum corresponds to the age of the Industrial Revolution that broke out in Britain in the 1780s. In this period, the East India Company introduced calico (a cotton product) to England. Its popularity posed a serious threat to England’s manufacturers of woolen products. That is why the newly emerging cotton industry in Britain tried to catch up with the technical level of the Indian calico and the Industrial Revolution of cotton textiles broke out.[26]
Why did the Industrial Revolution and modern capitalism take place in 18th century Europe and not in other parts of the world such as India or China? Max Weber (a German political economist, and sociologist) asked this question and he credited it to the different religious ethos.[27] But you cannot credit modern capitalism to the Protestant work ethic because the Protestant work ethic is the product of the Little Ice Age. Here again, we can attribute it to climate difference. As IPCC states, “the “Little Ice Age" appears to have been most clearly expressed in the North Atlantic region as altered patterns of atmospheric circulation.[28]“ This is because the Industrial Revolution first took place in Britain that faces the North Atlantic.
4. Climate and Economy
Economic activity fluctuates, forming business cycles. There are several types of business cycles, notably the Kondratiev Cycle (45-60 years), the Kuznets Cycle (15-25 years), the Juglar Cycle (7-11 years), and the Kitchin Cycle (3-5 years). In this section, we will see that climate change causes these business cycles.
4.1. The Kondratiev Cycle
The Kondratiev Cycle is a wave that the Russian economist Nikolai Kondratiev, a Russian economist, discovered[29]. It is usually thought to be that of economic growth, but it is actually that of prices or interest. The following chart shows the correlation of the Δ price index in Britain and sunspot numbers from 1750 to 2006. It adopts an 11-year moving average to smooth 11-year fluctuation.

The correlation between them before 1800 is -0.67, while that after 1801 is + 0.51. How can we explain such a reversal of correlation?
The decrease in sunspot number leads to more cloudiness, a drop in temperature, and poor harvest. Before the Industrial Revolution, it resulted in inflation, because the limited supply could not meet the increasing demand for clothing and food. Nations often made war to acquire scarce resources, which accelerated further inflation.
After the Industrial Revolution, improved productivity can solve the problem of the supply shortage. Instead of poverty and inflation, richness and deflation have become the cause of the crisis. When the sunspot number increases, resources become abundant enough to lead to deflation and unemployment. Governments often make war for Military Keynesianism.
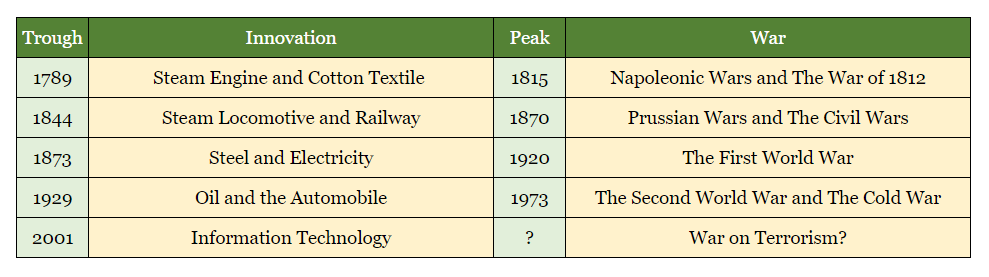
So, at the descending phase of the Kondratiev Cycle, technological innovation takes place to meet the increasing demand and at its ascending phase, wars break out to reflate the money supply, re-create demand, and push unemployment down. You can recognize it in the following table that includes five Kondratiev Cycles after the Industrial Revolution.
4.2. The Kuznets Cycle
The Kuznets Cycle is a wave that the American economist Simon Kuznets discovered.[31] It is often called an infrastructural investment cycle, but the question is why such long-term infrastructure investment fluctuates at this interval.
Brian Joe Lobley Berry enumerated “two Kuznets cycles per Kondratiev wave."[32] As I explained, the Kondratiev wave is a cycle of prices and interest and is independent of the cycle of economic growth. Hence, there are four combinations of the two factors. We can name each as follows.
- rising prices + growing economy = reflation
- rising prices + stagnating economy = inflation
- falling prices + growing economy = disinflation
- falling prices + stagnating economy = deflation
These four combinations in this order correspond respectively to ascending, peak, descending, and trough phases of the Kondratiev cycle. Thus the Kondratiev cycle comprises two Kuznets cycles. Let us examine each phase.
- Reflation is the phase of escaping deflation by increasing the money supply (a gold rush or an easy-money policy) and/or public undertaking (especially war). The rise in nominal interest rates booms economic growth.
- Inflation is the phase of the excessive money supply and the shortage of resources, which ends up with stagflation. Stagflation usually appears after the war.
- Disinflation is the phase of escaping inflation by decreasing the money supply (a tight-money policy) and cutting down expenses both in the public and the private sectors. The drop in nominal interest rates booms the economic bubble.
- Deflation is the phase of the excessive money supply and the shortage of resources, which ends up in a financial crisis. A financial crisis usually appears after the bubble burst.
The Kuznets Cycle might have something to do with the Hale cycle, a 22-year cycle in the reversal of the magnetic field of the Sun.
4.3. The Juglar Cycle
The Juglar Cycle is a wave that Joseph Clément Juglar, a French physician and statistician discovered.[33] Fluctuation of investment in plant and equipment is usually thought to drive this business cycle, but we must inquire further why the investment fluctuates. The following graph depicts the correlation of Δ “Indices of Industrial Production" in Japan and reversed sunspot numbers from 1978 to 2007. It adopts a 39-month moving average to smooth the 39-month fluctuation I will explain in the next section.

It shows when the sunspot number decreases (the broken line ascends), production increases, and when the sunspot number increases (the broken line descends), production decreases. As Jevons anticipated, solar activity has an influence on economic activity.
4.4. The Kitchen Cycle
The Kitchen cycle is a wave that the American economist Joseph Kitchen discovered.[35] It is often called an inventory cycle, but the fluctuation of inventory cannot be the ultimate cause of the business cycle, because it depends on the fluctuation of consumption and we must inquire about the cause of the latter fluctuation.
The period of this cycle is near that of atmospheric oscillations, such as ENSO (El Niño/Southern Oscillation), NAO (North Atlantic Oscillation), and AO (Arctic Oscillation). The following graph depicts the correlation of the Δ inventory ratio in Japan and the reversed NAO index. It adopts a 12-month moving average to smooth 12-month fluctuation.

The North Atlantic Oscillation influences Japan’s climate via Arctic Oscillation. When NAO becomes positive, that is to say, the broken line descends, the summer of Japan becomes cool and the inventory ratio decreases. When NAO becomes negative, that is to say, the broken line ascends, the summer of Japan becomes hot and the inventory ratio increases.
The relation of temperature and prosperity in the Kitchen Cycle is similar to that in the Juglar Cycle. When it gets warmer, the atmospheric circulation is activated, systems can easily reduce entropy, resources become abundant, the demand decreases, new products are not sold, and thus the inventory ratio increases. When it gets cooler, the atmospheric circulation stagnates, systems have difficulty in reducing entropy, resources become scarce, the demand increases, new products are well sold, and thus the inventory ratio decreases.
There is the quasi-biennial cycle in the sunspot number fluctuation, but it is so weak that there might be another cause of the atmospheric oscillations. Masayo Ogi et al. connected NAO and the 11-year solar cycle and said, “the influence of the winter NAO on the summer climate is modulated by the solar cycle through the surface cryospheric processes."[37] Not only the quasi-biennial cycle but also the 11-year cycle of solar activity might affect the atmospheric oscillations.
5. References
- Jared M. Diamond. The Third Chimpanzee: The Evolution and Future of the Human Animal.
- Marshall Sahlins. Stone Age Economics.
- Hubert H. Lamb. Climate, History and the Modern World.
- Brian Fagan. The Little Ice Age: How Climate Made History 1300-1850.
- ↑William Stanley Jevons (1875) Influence of the Sun-Spot Period on the Price of Corn, Nature; William Stanley Jevons (1878) Commercial Crises and Sun Spot, Nature.
- ↑ William Herschel (1801) Observations tending to investigate the nature of the sun in order to find the causes or symptoms of its variable emission of light and heat, Philosophical Transactions of the Royal Society, London, 91. p. 354-362.
- ↑The Intergovernmental Panel on Climate Change (2001) Climate Change 2001, The Scientific Basis, 6.11.1.1
- ↑H. Svensmark and E. Friis-Christensen (1997) Variation of cosmic ray flux and global cloud coverage – a missing link in solar-climate relationships, Journal of Atmospheric and Solar-Terrestrial Physics, vol.59, No.11. p.1225-1232.
- ↑D.D. Zhang, J. Zhang, H.F. Lee, Y. He (2007) Climate Change and War Frequency in Eastern China over the Last Millennium, Human Ecology, Volume 35, Issue 4. p.403
- ↑Lorraine E. Lisiecki (2005) A Pliocene-Pleistocene stack of 57 globally distributed benthic δ18O records, Paleoceanography, Vol. 20, PA1003.
- ↑Data from Petit, J.R., et al. (2001) Vostok Ice Core Data for 420,000 Years, IGBP PAGES/World Data Center for Paleoclimatology, Data Contribution Series #2001-076. NOAA/NGDC Paleoclimatology Program, Boulder CO, USA.
- ↑Marian Vanhaeren et al. (2006) Middle Paleolithic Shell Beads in Israel and Algeria, Science, Vol. 312, No. 5781. p. 1785.
- ↑BBC NEWS (2006) Study reveals ‘oldest jewellery’. Reported by Paul Rincon.
- ↑Ralf Kittler, Manfred Kayser, and Mark Stoneking (2003) Molecular Evolution of Pediculus humanus and the Origin of Clothing, Current Biology, vol. 13. p. 1414-1417.
- ↑Stanley H. Ambrose (1998) Late Pleistocene human population bottlenecks, volcanic winter, and differentiation of modern humans, Journal of Human Evolution, 34 (6): 623–651; Ambrose, Stanley H. (2005) Volcanic Winter, and Differentiation of Modern Humans, Bradshaw Foundation.
- ↑Jared Diamond (1992) The Third Chimpanzee: The Evolution and Future of the Human Animal, Harper Perennial. p.32-58.
- ↑Data from National Snow and Ice Data Center, National Oceanic & Atmospheric Administration, U.S. Department of Commerce. “GISP2 Bidecadal Oxygen Isotope Data." Accessed. 2002/07/01.
- ↑Gordon Hillman et al (2001) New evidence of Lateglacial cereal cultivation at Abu Hureyra on the Euphrates, The Holocene, Vol. 11, No. 4. p. 383-393.
- ↑Marshall David Sahlins (1972) Stone-Age Economics. p.9.
- ↑Andrew Sherratt (1983) The Secondary Exploitation of Animals in the Old World, World Archaeology, Vol. 15, No. 1, Transhumance and Pastoralism, pp. 90-104.
- ↑Childe, V. Gordon. “The Urban Revolution." ‘’Town Planning Review’’ 21, no. 1 (April 1950): 3.
- ↑Data from National Snow and Ice Data Center, National Oceanic & Atmospheric Administration, U.S. Department of Commerce (1997) GISP2 Bidecadal Oxygen Isotope Data.
- ↑Data from Seppa, H. and Birks, H.J.B. (2001) July mean temperature and annual precipitation trends during the Holocene in the Fennoscandian tree-line area: pollen-based climate reconstructions, The Holocene, Volume 11, Number 5, pp. 527-539.
- ↑Hideo Suzuki (1978) Kiko to Bunmei, Asakura Shoten. p.1-69.
- ↑H. H. Lamb (1995) Climate, History and the Modern World, Second edition, Routledge. p.125. The people who were engaged in building the Pyramid were not slaves.
- ↑Karl Jaspers (1949) Vom Ursprung und Ziel der Geschichte. p.20.
- ↑Haeckel said, “Die Ontogenie ist eine kurze Recapitulation der Phylogenie in Ernst Haeckel (1874) Anthropogenie oder Entwicklungsgeschichte des Menschen, Kapitel 1.
- ↑Sigmund Freud (1913) Das Interesse an der Psychoanalyse, Gesammelte Werke, Bd.8. p.413.
- ↑Mann, M.E. and P.D. Jones(2003)2,000 Year Hemispheric Multi-proxy Temperature Reconstructions, World Data Center for Paleoclimatology, Data Contribution Series #2003-051, NOAA/NGDC Paleoclimatology Program, Boulder CO, USA.
- ↑Toshiharu Kitamura (2002) International Trade and Technology, a paper presented at symposium “Islam and Information & Telecommunication Technology" held by Center for Asian Studies of Cairo University and Institute of Egyptology of Waseda University.
- ↑Max Weber (1920) Gesammelte Aufsätze zur Religionssoziologie
- ↑IPCC (2001) Climate Change 2001: The Scientific Basis, 2.3.3 Was there a “Little Ice Age" and a “Medieval Warm Period"?
- ↑Nikolaj Dmitriewich Kondratjev (1925) Boljshije cikli konjunkturi, Voprosi Konjunkuri.
- ↑Data from US National Geophysical Data Center (2007) Sunspot Number.
- ↑Simon Kuznets (1930) Secular Movement in Production and Prices, Boston, Houghton-Mifflin.
- ↑Brian Joe Lobley Berry (1991) Long-Wave Rhythms in Economic Development and Political Behavior, The Johns Hopkins University Press. p.66.
- ↑Clément Juglar (1862) Des crises commerciales et de leur retour périodique en France, en Angleterre et aux Etats-Unis, Guillaumin
- ↑Data from Japan Ministry of Economy, Trade and Industry (2007) Indices of Industrial Production, Historical Data; US National Geophysical Data Center (2007) Sunspot Number.
- ↑Joseph Kitchin (1923) Cycles and Trends in Economic Factors, The Review of Economics and Statistics, Vol.5, No.1. p.10-16
- ↑Data from Japan Ministry of Economy, Trade and Industry (1978-2002) Inventory Rate; US National Weather Service (1950-2006) Monthly mean NAO index since January 1950.
- ↑Masayo Ogi et al. (2003) Solar cycle modulation of the seasonal linkage of the North Atlantic Oscillation, Geophysical Research Letters, VOL. 30, NO. 22, 2170